If you’re a Shopify store owner, managing your online store can be complicated. There’s lots of data about your store’s performance that can help you improve the way it runs. And Shopify reports can help you navigate through that data and learn how your customers are arriving at your site, what they’re interested in buying, how much they’re spending, and more.
Shopify reports are based on the action-driven approach to business analysis. Shopify offers you broad insight into your business and provides you with information that would help you make business decisions that could positively your store’s performance.
Once you have created your Shopify account head to the analytics section of your dashboard. All Shopify reports are located under the Analytics section of your shop admin:分析–>报告。
Whether you’re a new online store owner or have been in this business for years, you will find Shopify reports incredibly useful. Shopify reports give you valuable data and insights about your products and customers, which will allow you to make informed decisions about your marketing campaigns, product design, sales strategy, and more.
Orders。See the total number of orders that were placed during a specified date range.
销售概述。How profitable is your Shopify store? Track the total sales of all products and services through your online store daily, weekly, monthly, yearly, or within a specified date range.
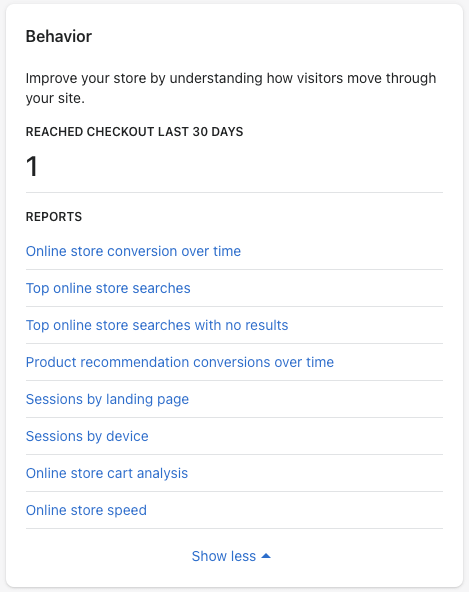
Here are the specific reports available within Shopify behavior reports:
Online store conversion over time
在线商店速度
Product recommendation conversions over time
Top online store searches
Top online store searches with no results
Sessions by landing page
通过设备会话
Online overall store cart analysis
Visitors by Landing Page Report On Shopify
Visitor by landing page report on Shopify shows where visitors land first once they visit your store. This report is especially useful to marketers as it gives some insight into your current content marketing and SEO strategy.
With these reports, you can measure the effectiveness of your marketing campaigns, understand how successful they are, and what you need to do to improve performance.
Shopify财务报告
You can think of Shopify Finances Reports as your financial statements. They offer a comprehensive overview of the income and expenses on your orders and give you more insight into your sales and money flow.
报告available within Shopify finances are:
总销售额
税
Tips
付款
The core financial metrics we recommend you to track within these reports are total sales and net sales.
The most important Shopify finances report is the Shopify finance summary, where you can see your sales, payments, liabilities, and actual profit. A separate report for each one of the items is available.
商业营业税报告
As an online seller, tax is a big part of your business. It’s also something you may not know all that much about. Good thing is that sales taxes on Shopify stores are paid when you sell or post a product or service, depending on your business setup. In the US, Canada, and EU, you need to specify the rates that apply to each location as well as charge the customer.
If you notice in the分析–> Reports –> Finances summary –> Taxes report, there’s a column named ‘Amount’. This is the total amount of sales tax you’ve paid during the reporting period. You can use this to create segmented reports.
Credit Card Reports On Shopify
Credit card report on Shopify is a good way to know your transactions, who paid, and how much they paid. The report has also information such as your average order value and the average number of days it takes to get paid. You can view this report in two different places:设置–> Payments –>Payment Providers, then查看支出。
如果您接受多个提供商的付款,请转到报告–> Finance –> Finances Summary, to see the breakdown.
Shopify Profit Reports
The profit reports on Shopify are a great way to keep track of your profit. Shopify Profit Report is created to help you measure your gross and net profits by产品,产品变体,和销售点地点。这些报告将帮助您分析并跟踪每日,每周或每月的利润率变化。
Do you want to find out which products are the most profitable? When you add or edit a product, Shopify automatically calculates your profit and profit margin for it. You just enter theCost per item, and Shopify does all the rest.
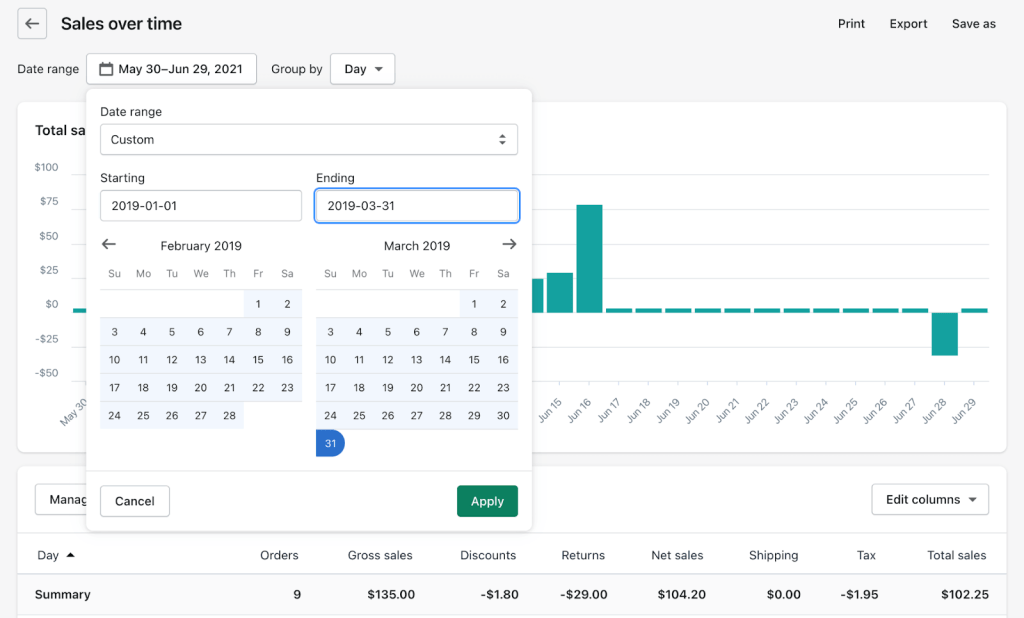
Total Sales is a Shopify report that gives you a complete picture of your online business’s sales. This report shows you how much money came into your Shopify account from all sources: sales, refunds, discounts, and more. Shopify uses the term ‘total sales’ to describe this unambiguous number.
The total sales report can be found underFinances reports –> Sales –> Total Sales。
Historic Sales Reports from Shopify
One of the most important aspects of running a business is being able to analyze your business’ growth trends over time. If you want to know past sales, there is an easy way of getting it: The Historic Sales Report.
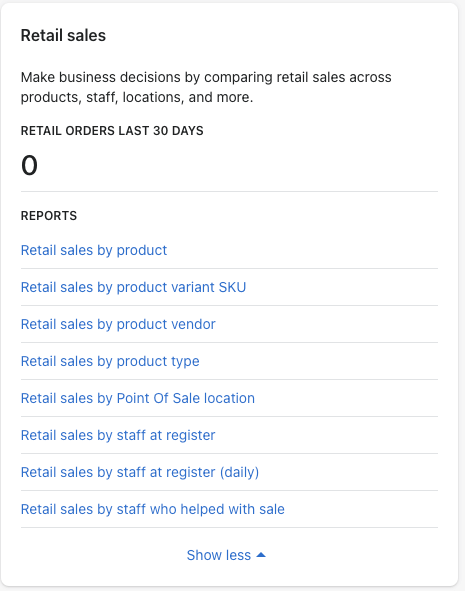
Shopify零售报告
Shopify零售展示您的业务报告is doing offline. However, note that this report is only available if you activated a Point of Sale as a sales channel on your store.
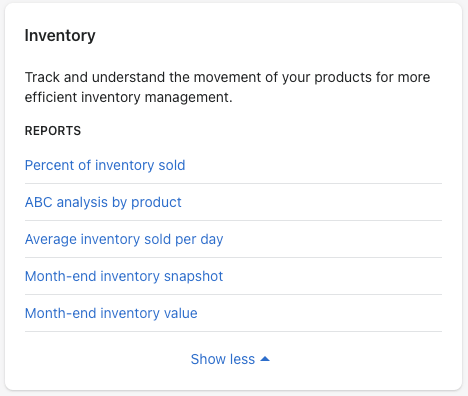
Shopify库存报告
Are youmonitoring your inventorycarefully? Shopify inventory reports help you keep track of the remaining inventory and give you insights into what sells and what doesn’t. Each report has its own unique features, but most of them give you sales insights, such as:
出售库存的百分比
ABC analysis by product
每天出售的平均库存
Month-end inventory snapshot
月末库存价值
Shopify PoS Reports
Shopify PoS reports offer a lot of useful insights about daily sales, stats related to net sales, average order values, top products, and more.
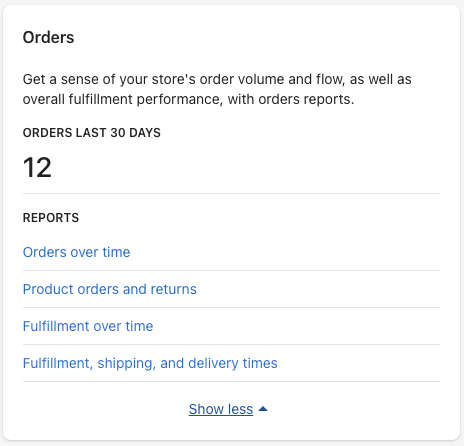
Shopify Order Reports
Shopify order reports help you analyze the volume of orders placed, shipped, delivered, or returned. The information available within these reports include:
随着时间的推移订单
Product orders and returns
随着时间的流逝
履行,运输和交货时间
Shopify Shipping Reports
Given Shopify’s limited shipping functionality, it’s up to you to determine where you want to store your shipping data. But you can get shipping insights from other reports we’ve already discussed. The best way to calculate shipping expenses is by exporting orders from a selected period as a .csv file and then uploading them into your favorite tool, such as Excel.
You also have an overview of the shipping total right from the Reports dashboard on Shopify. Navigate toFinances Summary–>总销售额, and select the desired period.
Shopify Product Reports
Shopify不提供独立产品报告,但它可以为您提供有关单个产品的见解。
Navigate toProduct –> All products, and click on the product you want to analyze. FindInsights和click onView Details。
A menu will pop up with this information:
最近90天的销售
这些销售归因于
The split between new and returning customers
You can learn more from the other actual reports.
Shopify Reports On Sales by Product Type
The standard reports are sufficient for most businesses and the product-specific report will allow you to gather information about sales by product type. For even deeper analysis, you can create a custom report.
Navigate to分析–> Reports和create a custom report by clicking the green button in the top-right corner. Select Sales over time as Report template. On the next screen, choose Product type from the dropdown menu, and type in the desired query.
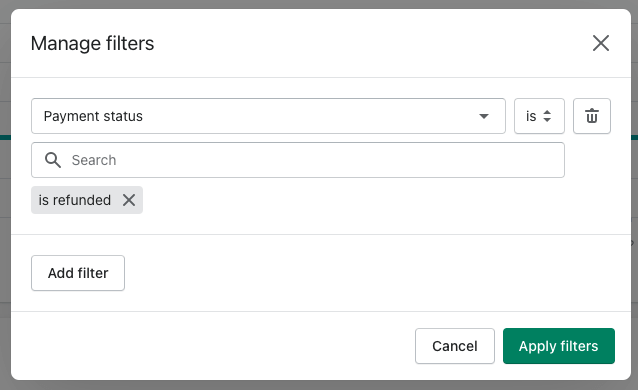
Shopify报告退款的产品
有一份报告列出所有退款产品非常有用。您可以使用它来确定退款的原因,进行库存检查等。按照上一步中的步骤来创建自定义报告。点击Manage filters, and set up the criteria as in the screenshot:
Shopify Accounting Reports
One of the most common questions that we get asked is “How do I generate accounting reports in Shopify?” The answer is – you don’t. Shopify does not offer separate account reports for bookkeeping entries. However, it does have a built-in feature called报告,这使您可以创建有关销售和退款细分,收取税款等报告的报告。您可以为特定时间段创建自定义报告,如下所示:
Shopify KPI Reports
Shopify reporting is already very powerful and insightful. You don’t need to do any of the calculations yourself — tracking the KPIs of your store is as simple as exporting the data into your favorite spreadsheets tool.
When applied to Shopify companies, KPIs are used to assess overall progress against strategic objectives, as well as gauge the performance of individuals within an organization. The main difference between KPIs and metrics is that while metrics are used to monitor and measure the status of a business process over time, KPIs are used to evaluate and compare the performance of different businesses.
Google Analytics(分析)或任何其他分析软件中的收购报告与Shopify获取报告不同。收购报告显示您从每个来源获得的访问,访问者和销售量。
Visits over time报告
This report shows the number of visitors and sessions during the specified time period. Find it underAcquisitionin the报告overview:
From here, you can play around by clicking the data table’s column headers to sort ascending or descending. Or dig deeper by choosing the default time period, like comparing the last 90 days to the 90 days prior, and so on.
Visitors by referrer report
该Shopify报告显示了来源提到的访问者和会议的数量。它位于Acquisitionin the报告overview as well.
As you can see, in this case, Google search is the most popular referral source.
The referral source is broken out by referral name. Use the column header sorting to end up with something like this:
现在,如您所见,Facebook是最重要的社交推荐来源。
This report provides you with a simple visits overtime report. You knowwhois visiting your site andhowoften, but you also knowwhere他们来自。这是关于在哪里投资您的钱的进一步决定的宝贵见解。
Visitors by location report
This Shopify report shows the number of visitors and sessions from various countries. It’s report is located atAcquisitionin the报告overview as well.
If you know which countries people are accessing your store from, you can use these to run ads more efficiently. Additionally, maybe you want to put some ad spend on a country that has potential.
分析行为报告
Shopify behavior reports focus on your visitors’ actions (behavior).
Top online store searches report
Shows the search terms your visitors use when looking throughout your site:
This report is located at“Behavior”in the“报告”overview:
This report can help you to figure out:
Voice of customer –您的客户如何思考和描述您通过特定查询出售的产品。
Product popularity– Search frequency shows product popularity.
UX confusion– Consider whether your navigation is clear and easy-to-use.
Top online store searches with no results report
顾名思义,该报告显示了流行的搜索词,这些词没有返回结果。它位于“Behavior”in the“报告”overview as well:
Product hierarchy– If you have a relevant product to match the popular query, but no results are being returned, move the product up the visual hierarchy.
登陆页面报告的访客报告
该报告显示,访问者首先到达您的商店。它位于“Behavior”in the“报告”overview as well:
This allows you to see at a glance where you’re appearing in search engine results, and which landing pages drive the most traffic from search engines. If you’re not seeing your business on page one of Google, this report can help you identify opportunities for optimization and acquisition.
Visitors by device
该报告显示了用于访问商店的设备类型。它位于“Behavior”in the“报告”overview as well:
This report can help you with:
Ad targeting- 使用上面的数据,您可以更精确地针对移动 /平板电脑 /桌面用户。
UX differs– Responsive UX design is a major factor when comparing different devices.
Separate testing– Test and experiment until you optimize for best results.
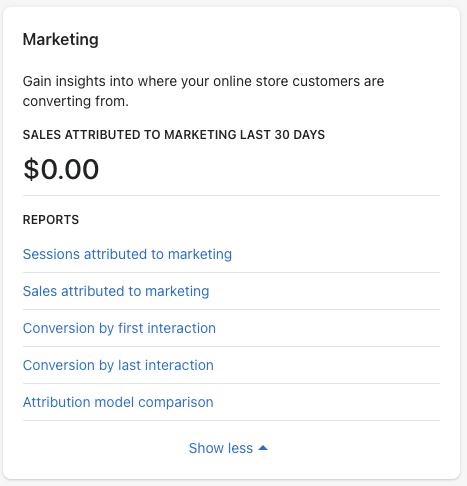
Analyzing Marketing Reports
Shopify’s built-in reports can help you understand the success of your marketing campaigns. They can tell you how well your recent marketing efforts are doing and where you might want to make changes.
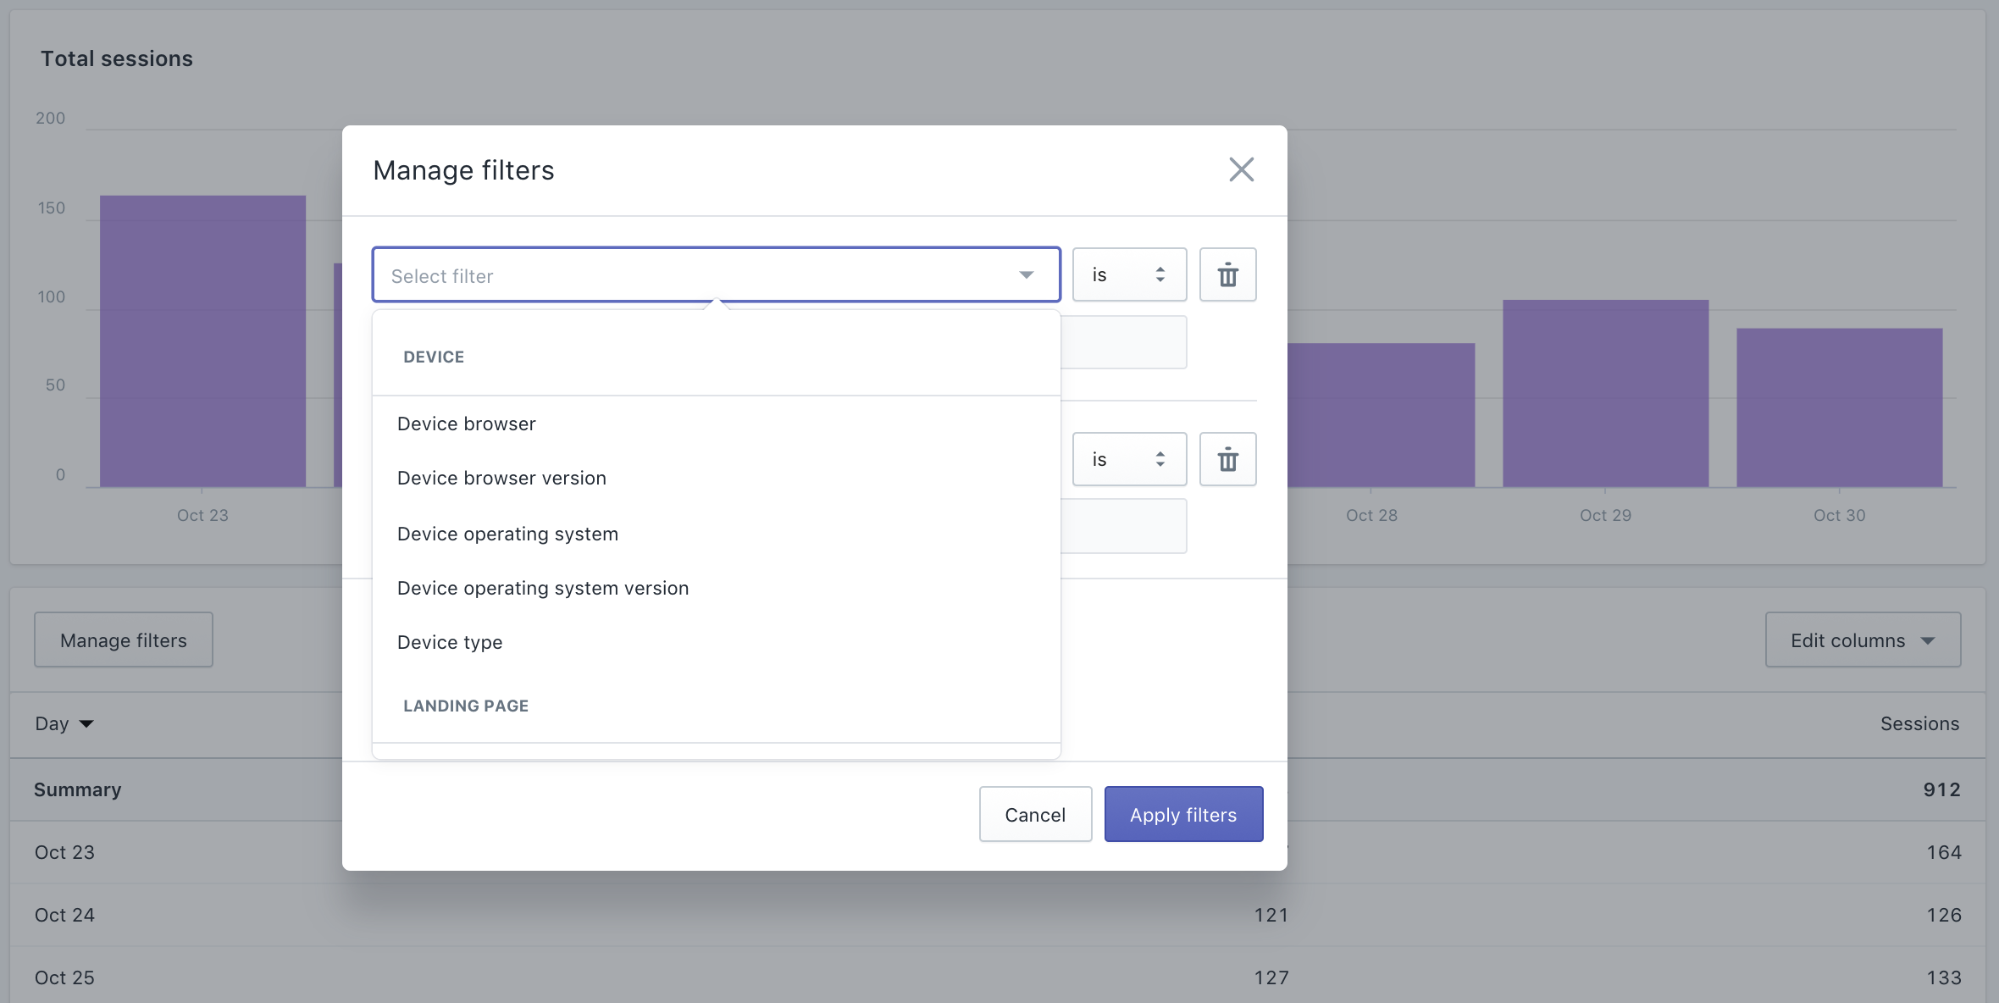
例如,if you want to see what percentage of your sales are coming from mobile devices, you can type “is” into the operator box and then “Mobile” into the values box. Shopify will then give you the results that fall into that specific category.
Find a “Manage filters” button at the top left of your data tables:
Some reports offer additional filtering options, like the search bar reports:
But filters aren’t the only tool available to you in reports.
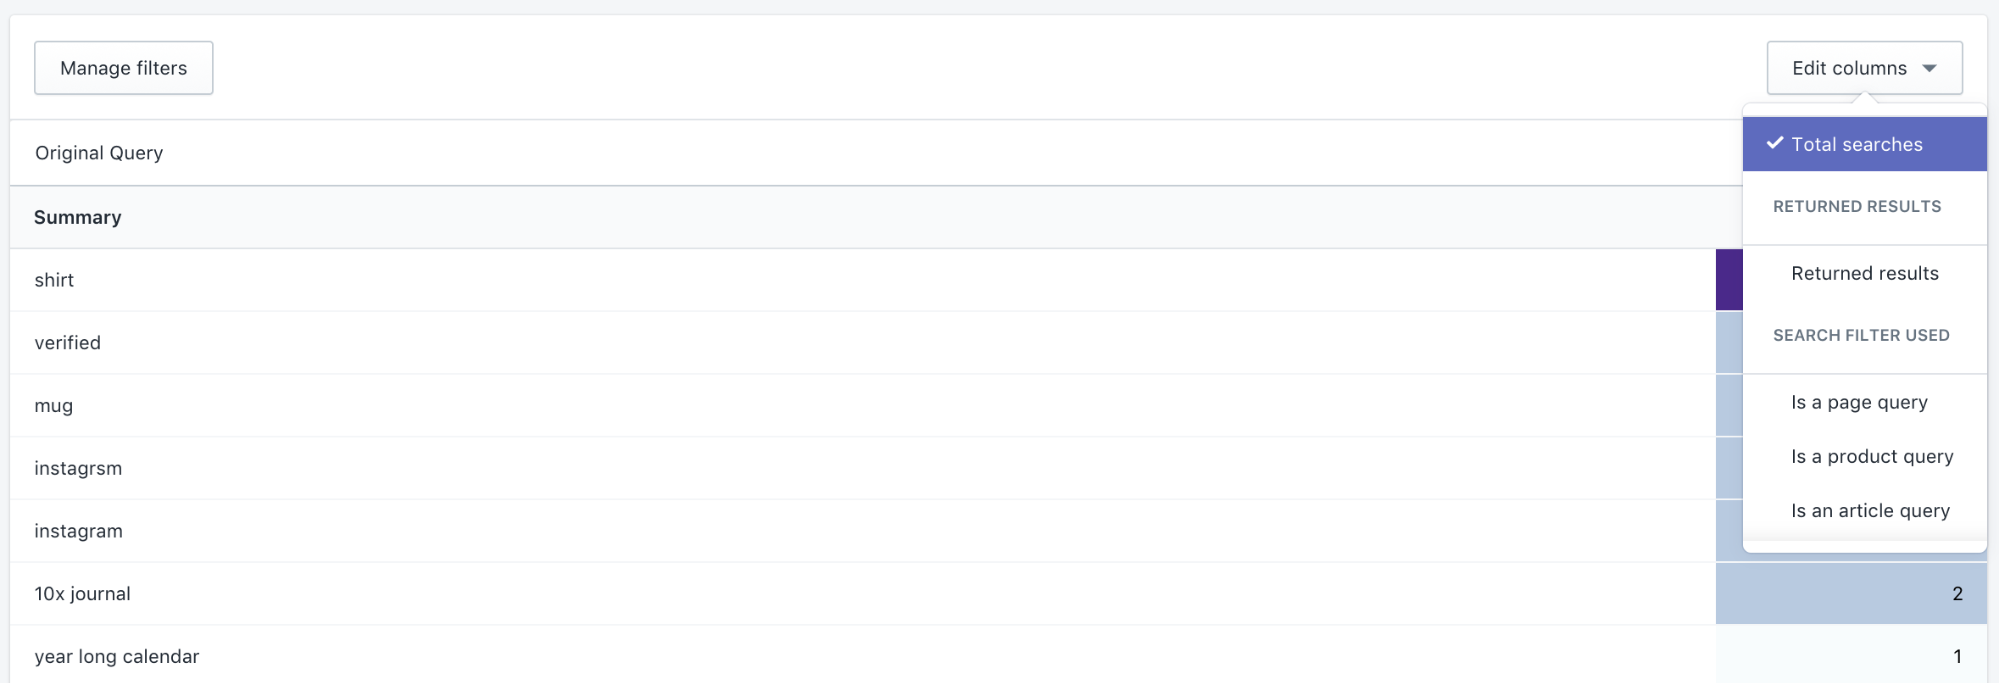
You can also use columns to add or remove data points from a report, which is useful when you have too much data to make sense of at once (e.g. adding the number of orders you made per day). Columns allow you to add and remove specific numbers from your report, like adding an extra column for a number of orders per day or changing a graph into a table.
By clicking the “Edit columns” you’ll see a dropdown menu with available columns:
一些报告提供了其他列选项,例如搜索栏报告:
在设备报告的访问者示例中,we added some filters and columns additionally.
One filter isolates mobile and one isolates visitors using iOS. The final data table shows information about mobile iOS users.
One column shows the version of iOS, one shows how long the average session duration is, and one shows the number of checkouts.
This freeShopify商店概述仪表板template can help you get a quick overview of the performance of your online store. Metrics cover everything from gross sales, orders, shopping cart overview, to top products sales, total customers, and more.
Online Sales Overview Dashboard
This freeOnline Sales Overview Dashboardtemplate below will help you get the most out of Shopify’s built-in sales reports as well as Facebook Ads, Google Analytics, and other e-commerce analytics tools. Additionally, the dashboard includes a graph that shows the performance of your sales including audience overview, shopping cart overview, and average order value.
最好的办法最Shopify报告ing is to automate it — and the best way to do that is with Databox. Automating the data collection process ensures that no data is ever missed, and it frees up your time for other more important things, like focusing on your product and growing your overall business.
第一步得到的Shopify报告ing is not what you might think.
而不是试图记住或回到检查the reports in your eCommerce dashboard, you can automate Shopify reporting and improve your online store monitoring with data visualization. Once you set up Databox, you can track conversion rates, engagement, and performance trends at a glance. The visualizations are automatically updated as new information is collected. This results in a continuous, data-driven approach to improving and optimizing your store.
免费注册和see how fast your online business will improve.
About the author
Djordje CvijovicGrew up as a Copywriter. Evolved into the Content creator. Somewhere in between, I fell in love with numbers that can portray the world as well as words or pictures. A naive thinker who believes that the creative economy is the most powerful force in the world!
Join 33,254 subscribers to receive latest posts.
We won’t spam, ever. It only takes a click to unsubscribe.