QuickBooks(2)
 Stripe(2)
 Xero(2)
 ProfitWell(4)
 PayPal(1)
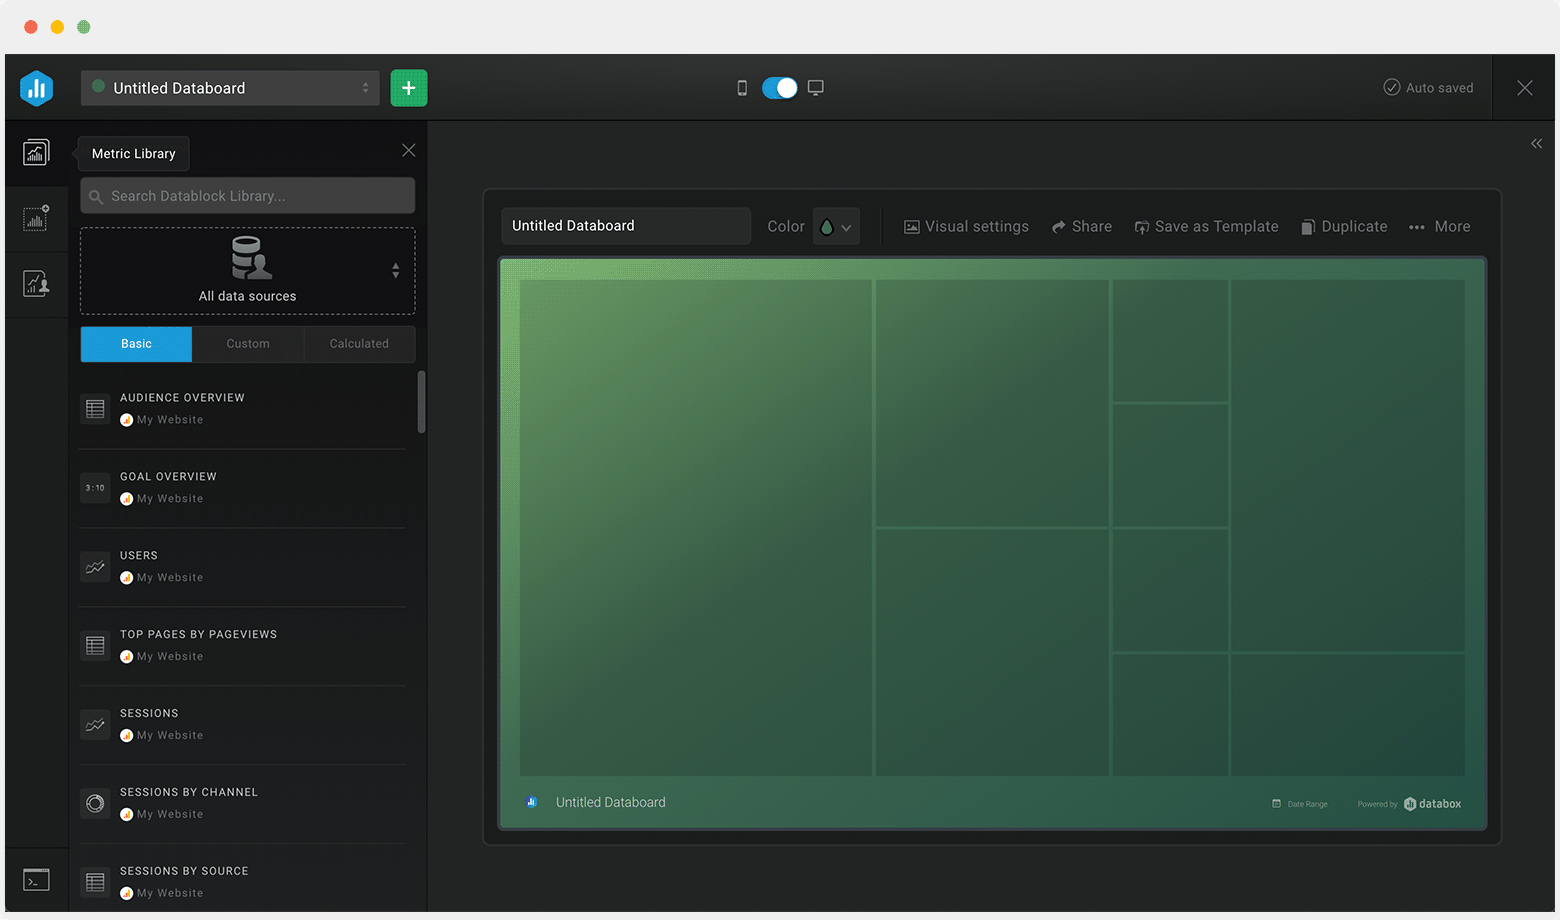
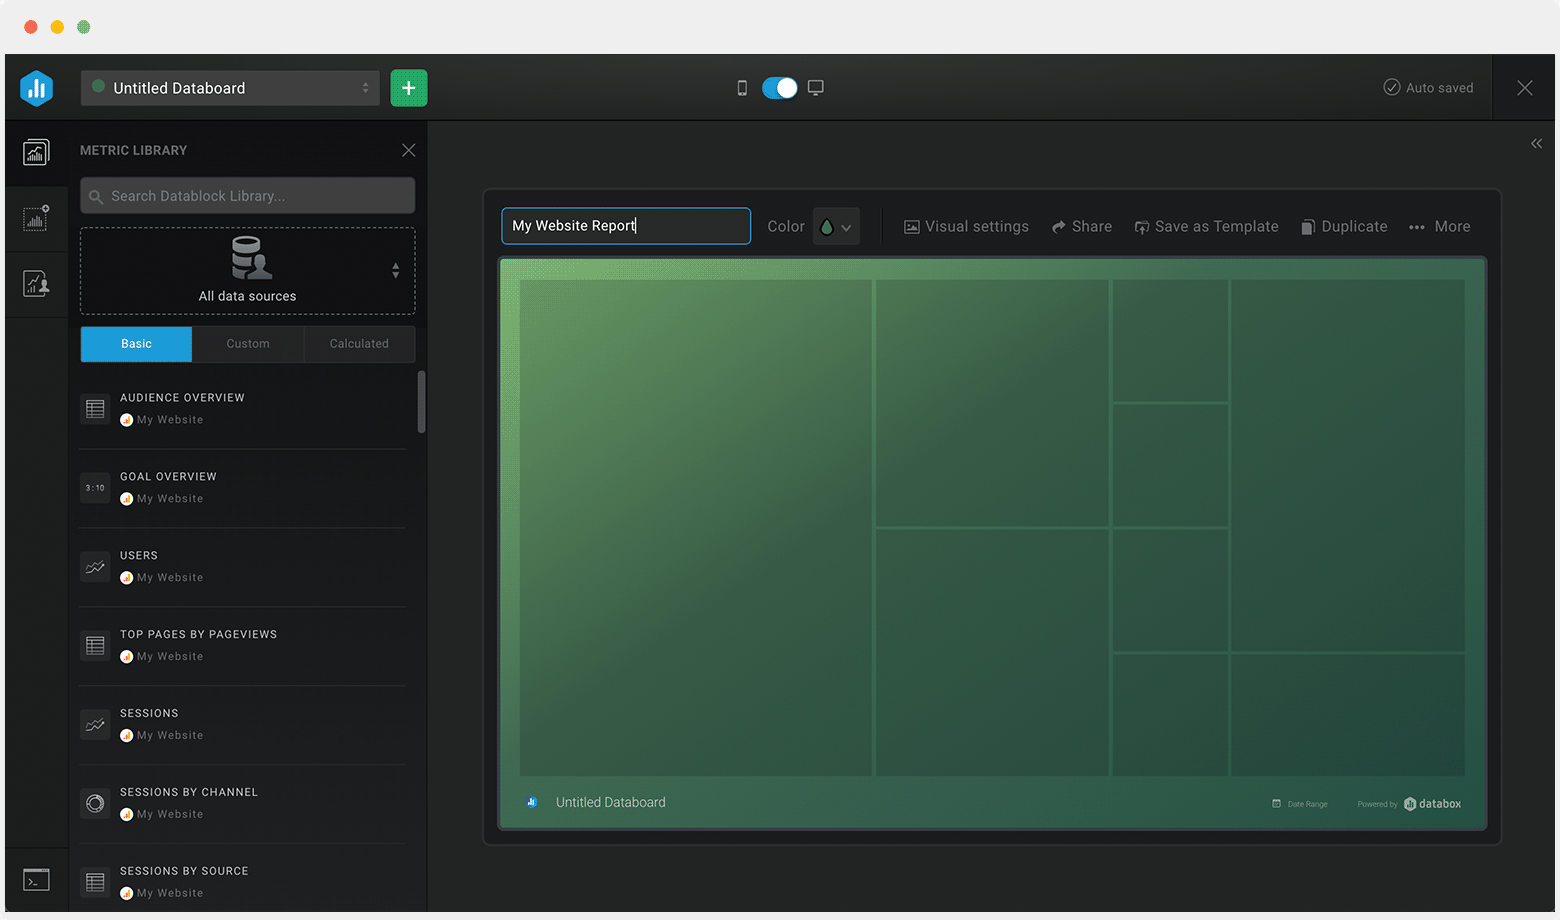
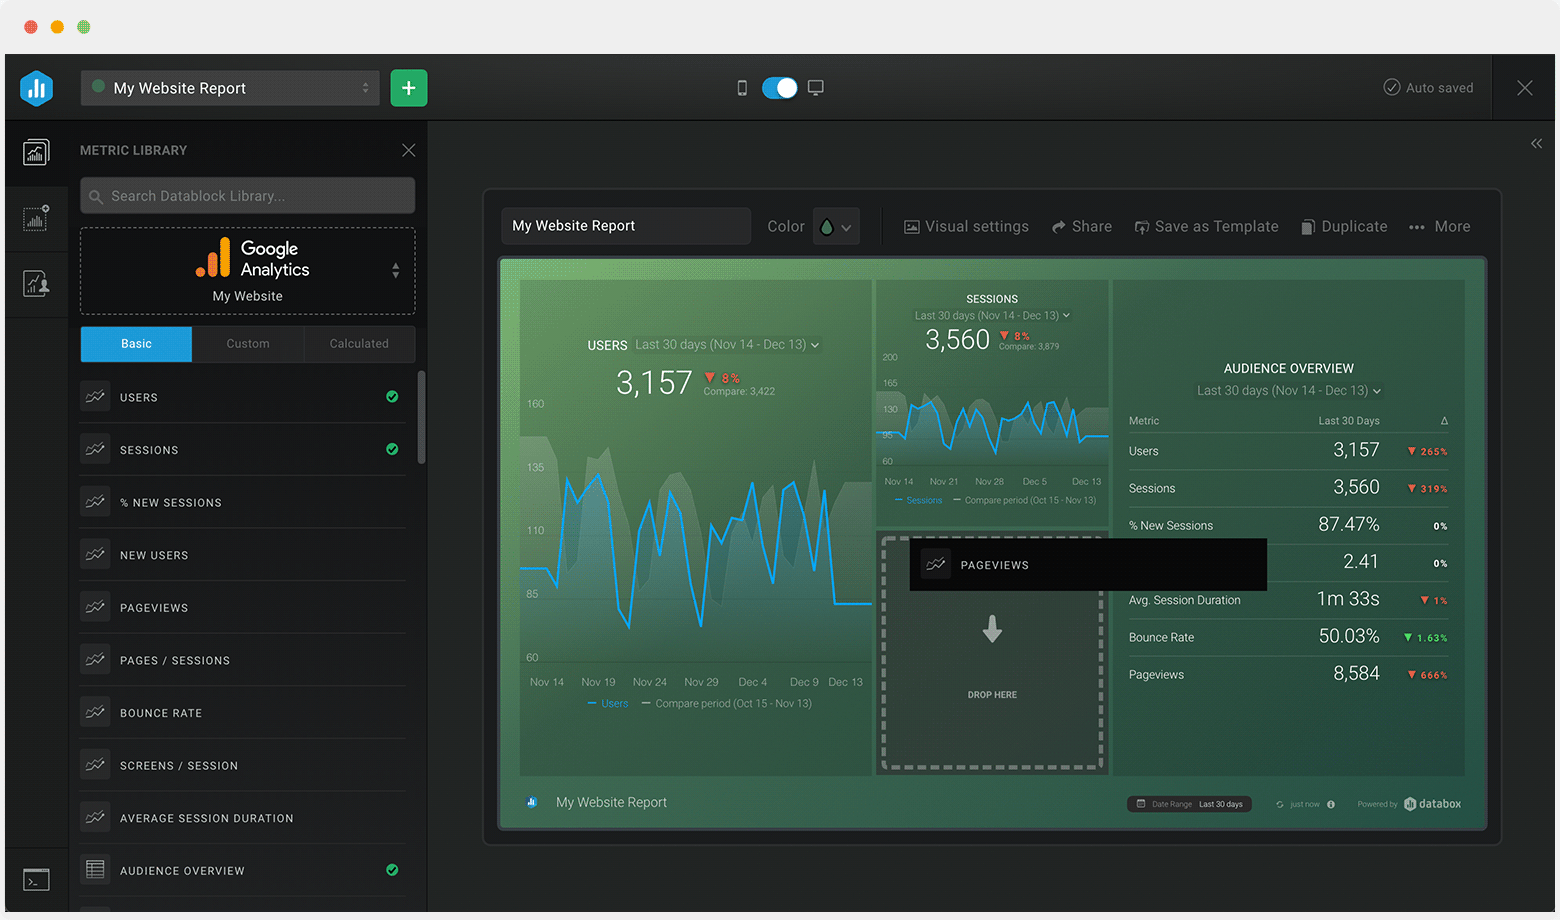
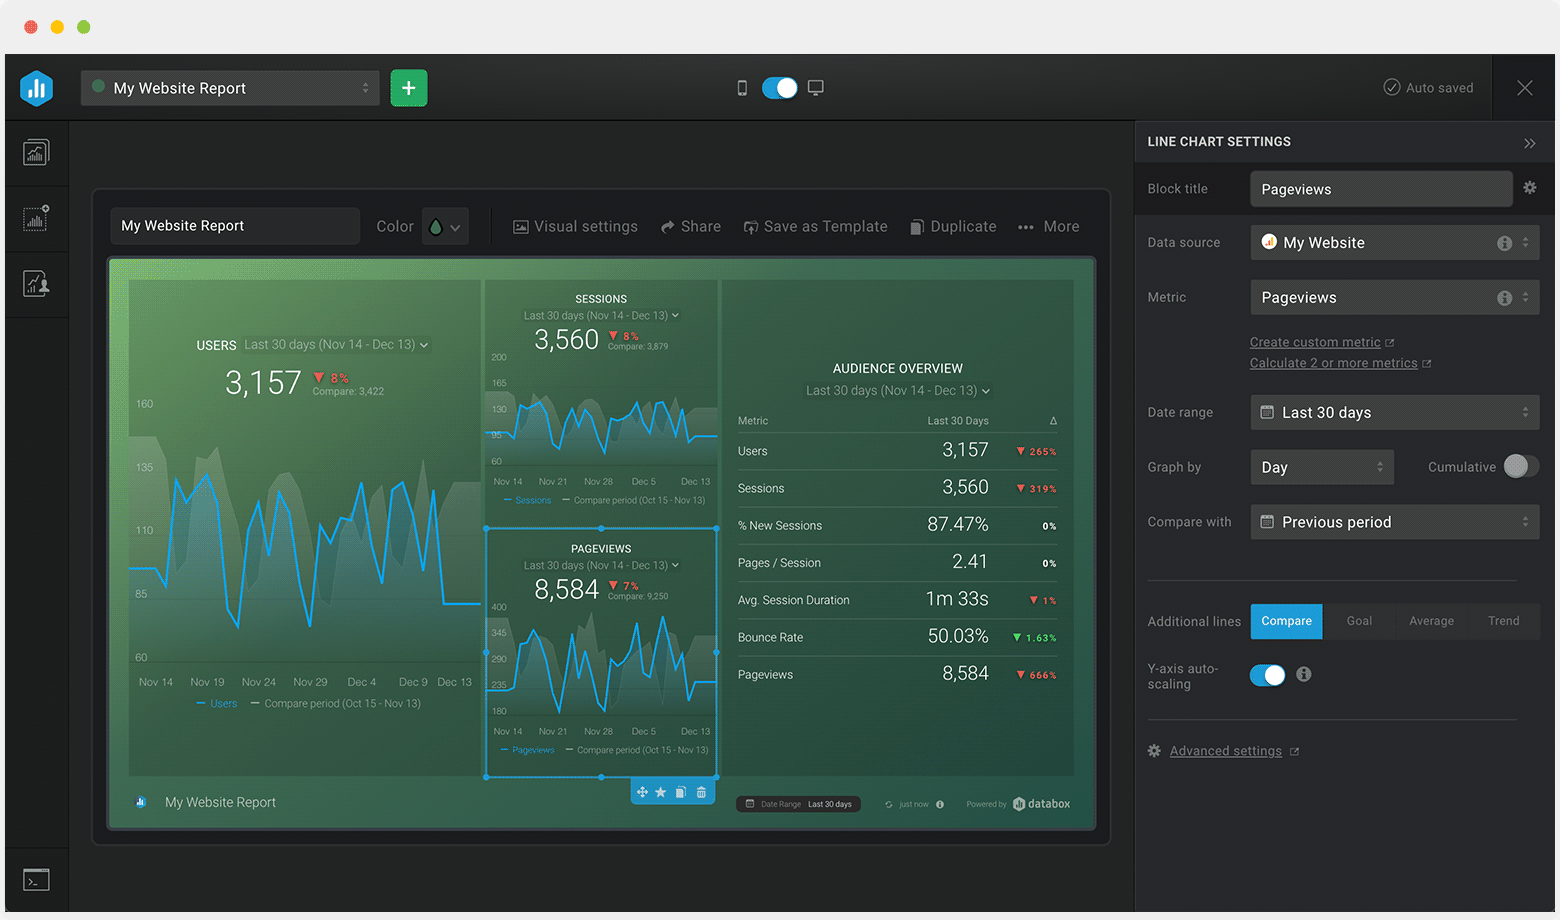
Track some of the most common Cash Flow metrics and KPIs and analyze your Cash Flow performance with just a few clicks.
TOP Cash Flow INTEGRATIONS
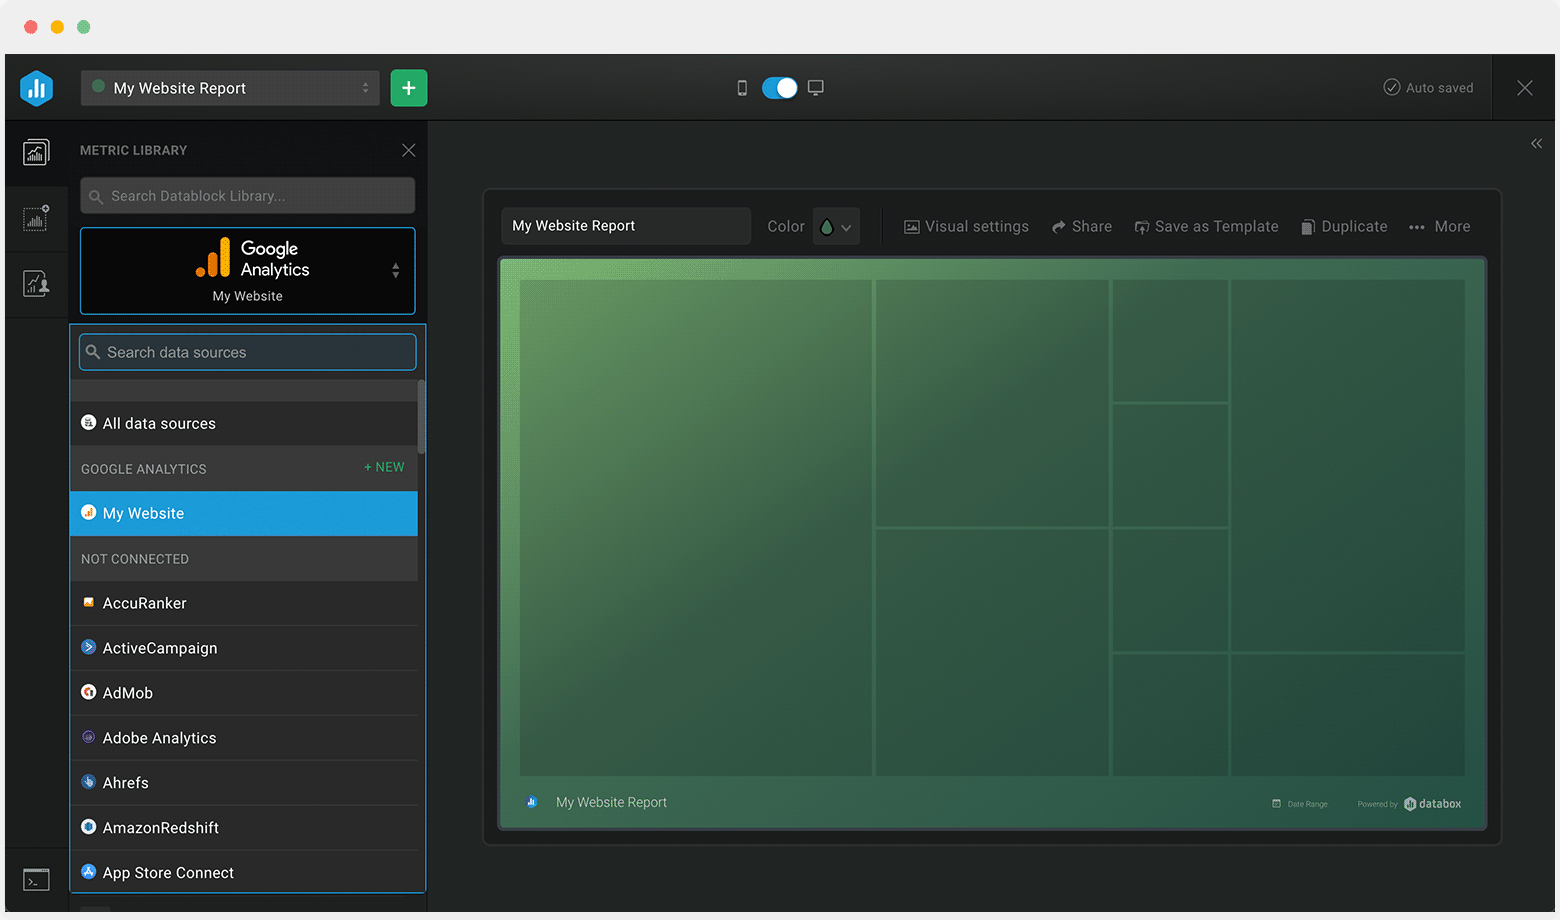
Don’t see your SEO tool?
You can build a dashboard with any data usingZapier,Integromat,Google Sheets, or aSQL database.
You can build a dashboard with any data usingZapier,Integromat,Google Sheets, or aSQL database.