Google Analytics(78)
 Marketo(1)
 Instagram Business(2)
 Mixpanel(1)
 Adobe Analytics(1)
 Google AdMob(1)
 Seventh Sense(2)
 mailchimp(2)
 Facebook Ads(5)
 YouTube(2)
 谷歌的AdSense(1)
 莫兹(1)
莫兹(1) LinkedIn Ads(1)
 stackadapt(2)
 集线器营销(62)
 Wistia(3)
 推特(3)
推特(3) Facebook Pages(5)
 LinkedIn Company Pages(3)
 Vimeo OTT(1)
 Drift(2)
 Google我的业务(2)
 Google Analytics(分析)4(4)
 Semrush(8)
 Google Ads(8)
 Hubspot CRM(12)
 Google Search Console(9)
 Shopify(1)
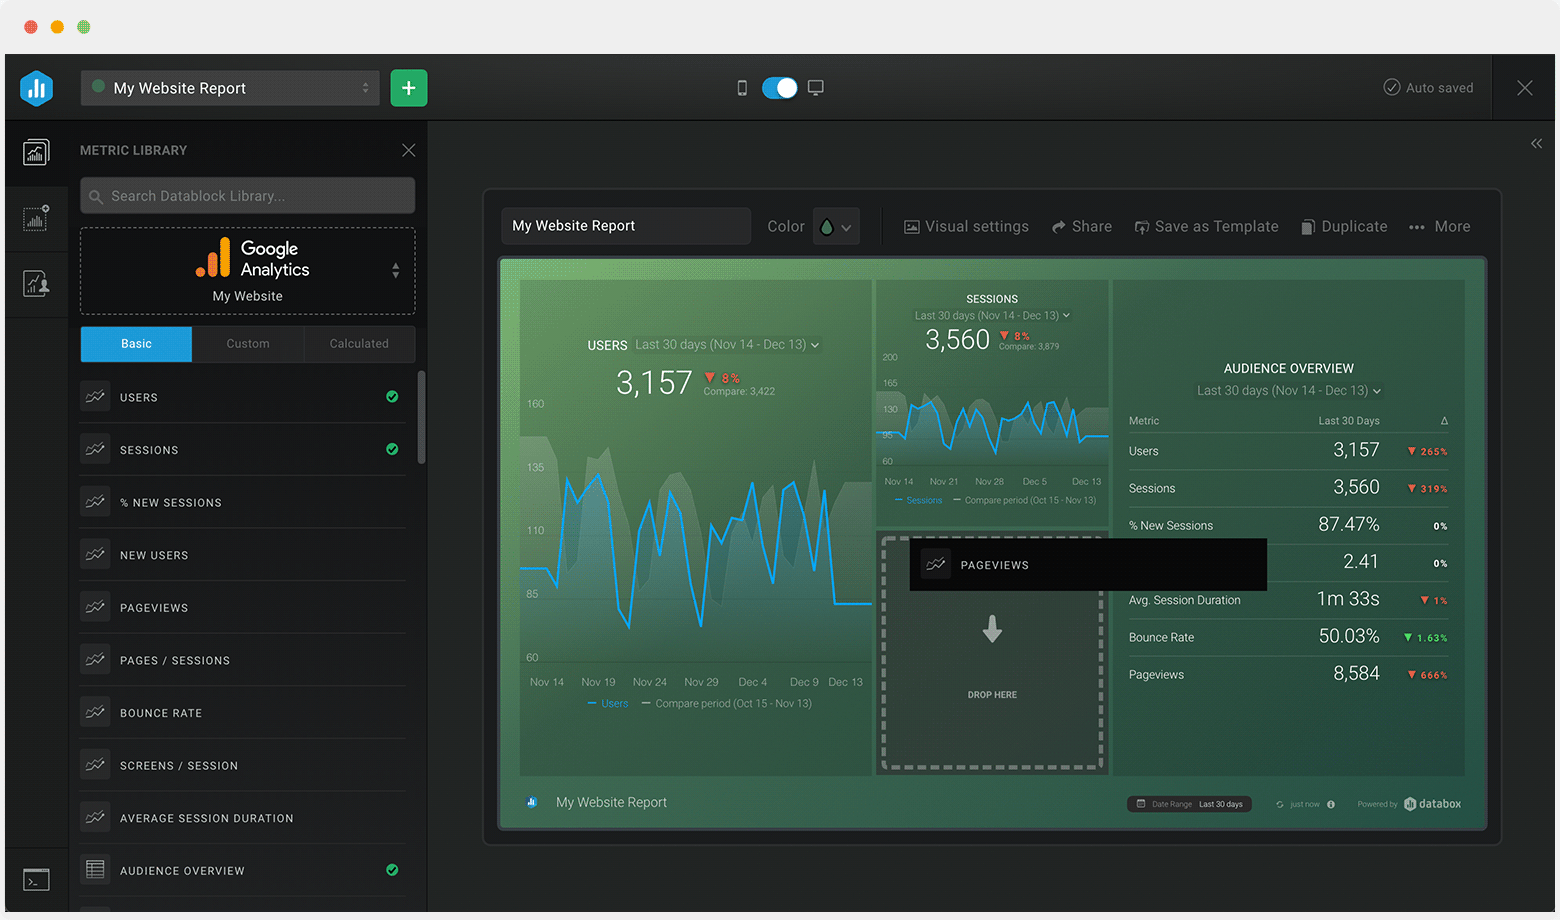
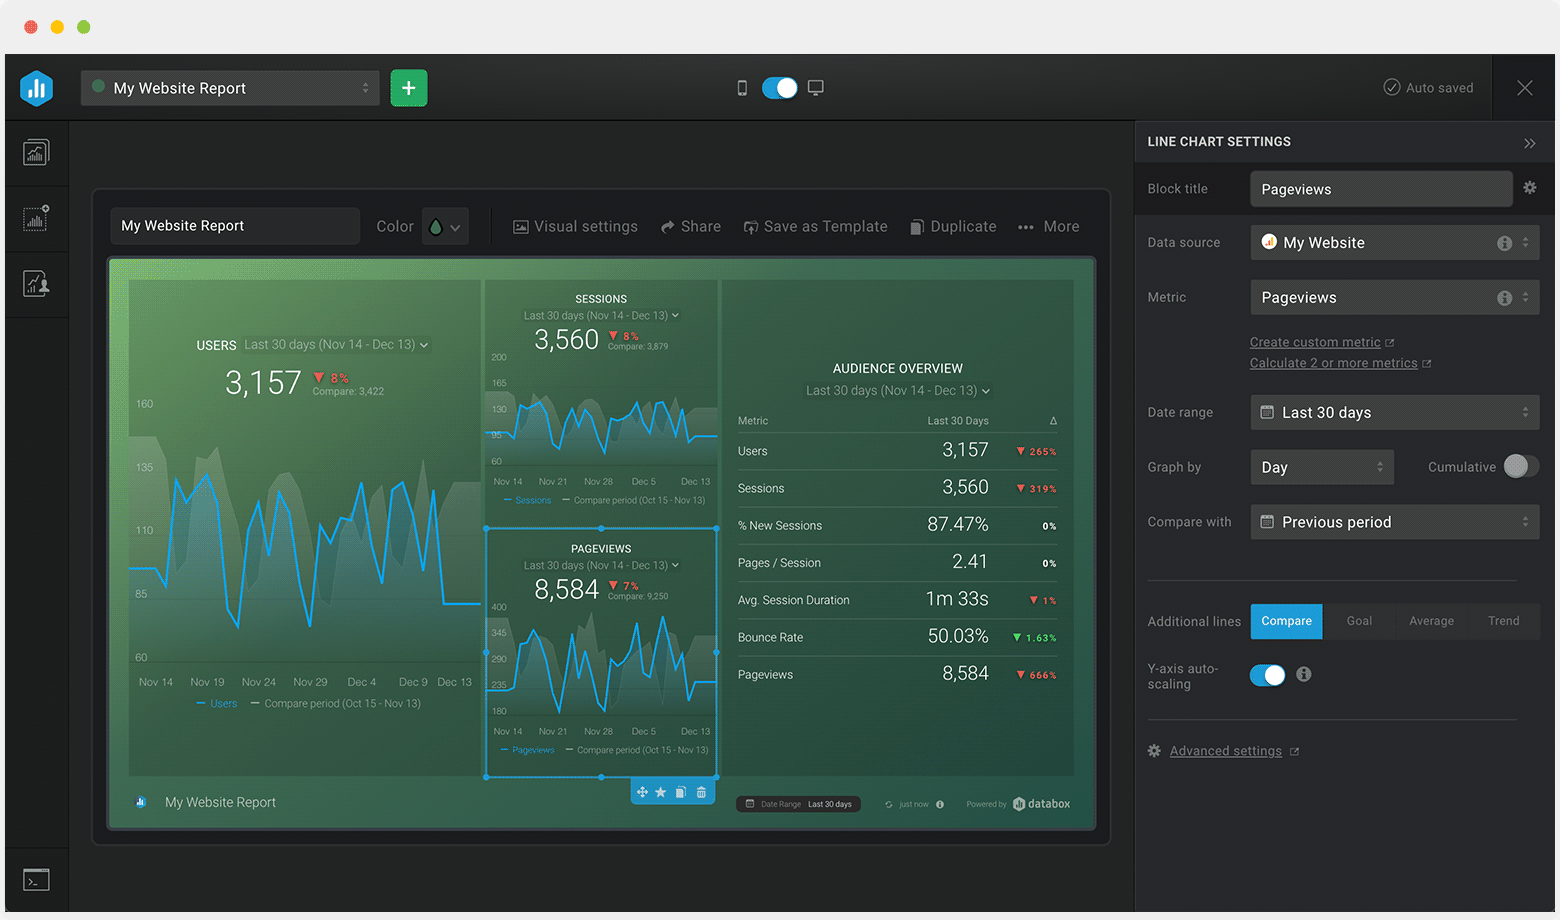
Track some of the most common Web Analytics metrics and KPIs and analyze your Web Analytics performance with just a few clicks.
TOP Web Analytics INTEGRATIONS
Don’t see your SEO tool?
You can build a dashboard with any data usingZapier,Integromat,Google表, or aSQL database.
You can build a dashboard with any data usingZapier,Integromat,Google表, or aSQL database.